这几天上的数据挖掘课,用到了Python里的matplotlib库里的一些函数,按照以下步骤就轻松安装了。
在Linux终端下依次输入下列命令:
$ sudo apt-get install python-dev python-setuptools
$ sudo easy_install django
$ python //进入python
>>> import django //查看django版本号
>>> django.VERSION
(1, 3, 0, 'final', 0)
sudo apt-get install python-numpy //必须
sudo apt-get install python-matplotlib //必须
前几条命令不是必须的,但以防万一,还是加上的好。
最后两条命令是分别装上numpy包和matplotlib包,其中numpy是matplotlib的先行包,里面的很多图形处理函数都要依赖numpy里的数学计算。
下面贴上部分制表的代码:
import matplotlib.pyplot as plt
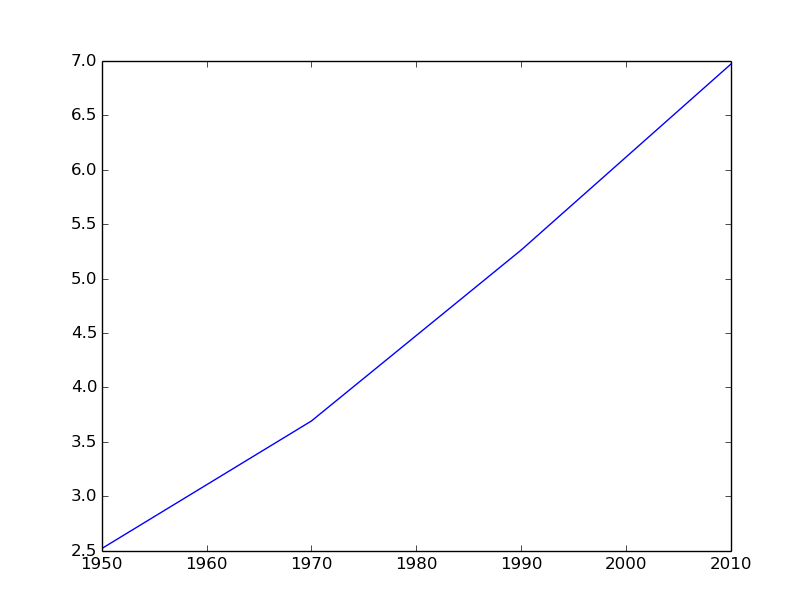
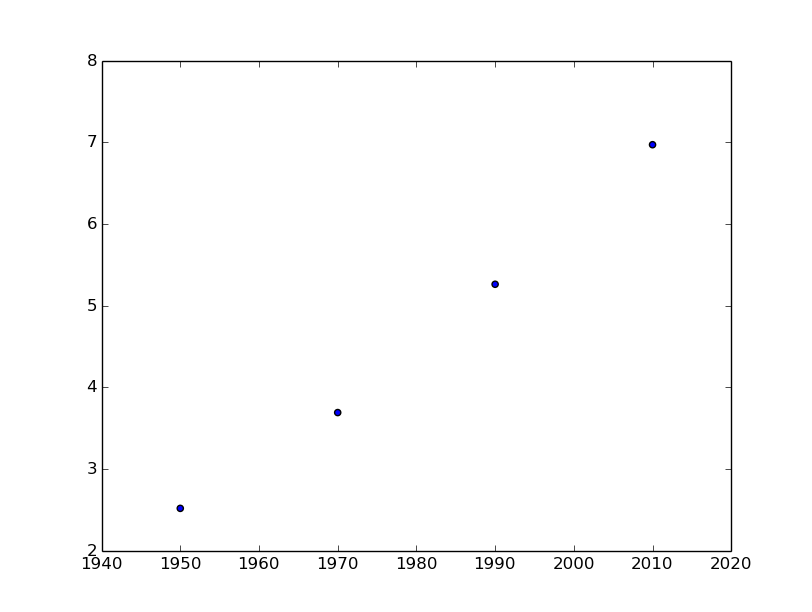
year = [1950,1970,1990,2010]
pop = [2.519,3.692,5.263,6.972]
#plt.plot(year,pop) \\plot是折线图
plt.scatter(year,pop) \\scatter是散点图
plt.show()
#help(plt.hist)


# -*- coding=utf-8 -*-
import matplotlib.pyplot as plt
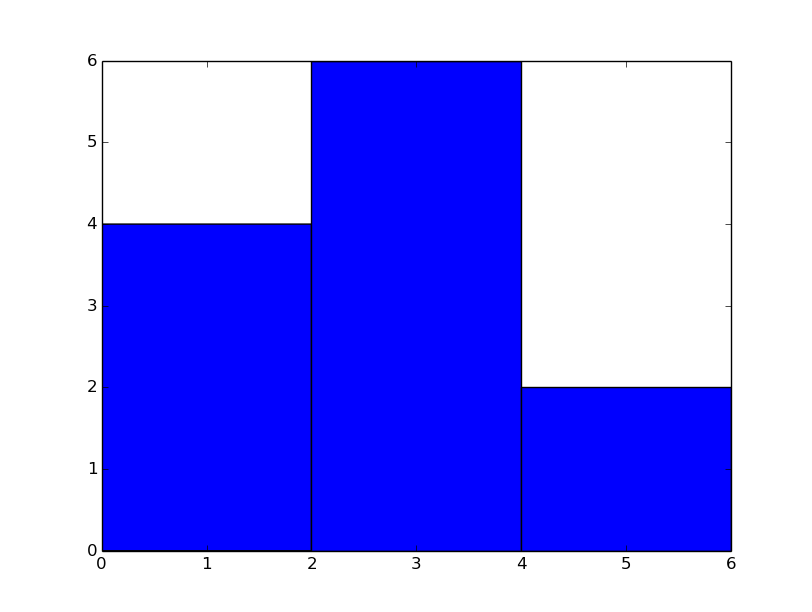
values = [0, 0.6, 1.4, 1.6, 2.2, 2.5, 2.6, 3.2, 3.5, 3.9, 4.2, 6]
plt.hist(values, bins = 3) #hist是直方图,values是list的集合,bins表示分成的组数
plt.show()

# -*- coding=utf-8 -*-
import matplotlib.pyplot as plt
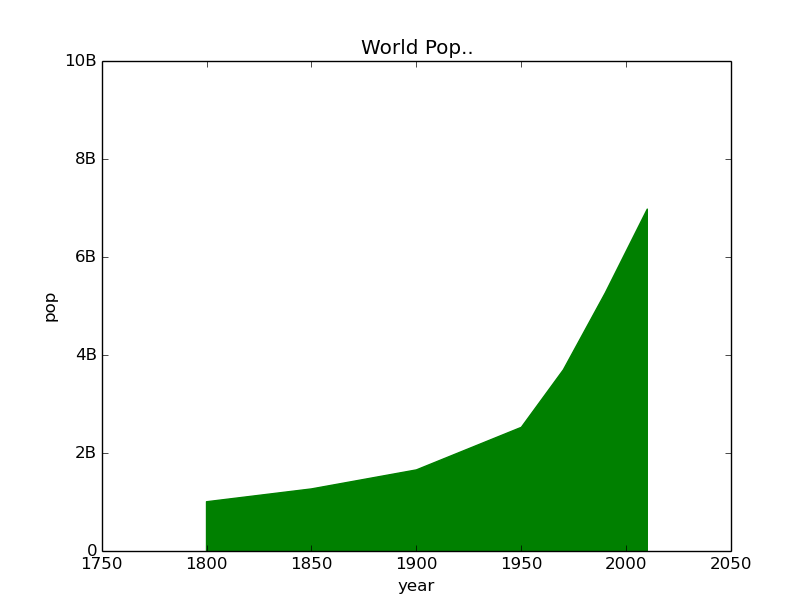
year = [1950,1970,1990,2010]
pop = [2.519,3.692,5.263,6.972]
#plt.plot(year,pop) #折线图
plt.fill_between(year,pop,0,color='green') #颜色填充图,以x=0为基准,与折线组成的图
plt.xlabel('year')#x轴名称
plt.ylabel('pop')#y轴名称
plt.title('World Pop..')#图标题
plt.yticks([0, 2, 4, 6, 8, 10],['0', '2B', '4B', '6B', '8B', '10B'])#y轴的刻度及单位
plt.show()


